Classifying Drones based on Sound Frequency
From January to March of this year, I worked with students from Chungnam National University (충남대학교) in South Korean in research regarding Neural Networks. Specifically, we wanted to create a Convolutional Neural Network that could classify different types of drones and whether they were carrying a payload or not using low cost microphones. The purpose of this system was focused on providing law enforcement or military support in identifying if drones were carrying bombs in high density population environments. The white paper we produced is linked below:
Practically Classifying Unmanned Aerial Vehicles Sound using Convolutional Neural Networks
TL;DR: Ultimately we weren’t able to make the system applicable in a practical environment due to noise variance. This means we couldn’t train the network to filter out wind or other noise that would occur in a real world environment, and these noise variances change the frequencies of other noises the microphones detect, ruining our type signatures. We didn’t have enough time to pursue solutions to this issue, which leads us to this post.
The paper is only 4 pages, so I highly encourage you read it, it has some pictures and graphs to complement the written out explanations. This post isn’t meant to rewrite the white paper, but explore methods of reducing sound variance that I hope to try and see if accuracy increases in the model as different systems are introduced.
If you consider frequency, it generally looks something like the following:
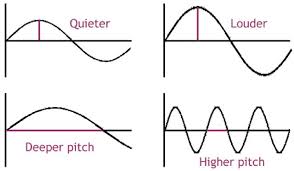
When considering sound, each sound source has an amplitude and frequency, the two defining parts of a sound waveform. Frequency is the pitch of the sound and can be measured by how close the waves are to each other, while amplitude is how loud a sound source is, and can be measured by how large the waves are. Using the frequency we can classify sound sources separately over a period of frequency, as long as the amplitude of one wave isn’t so loud it masks another wave.
The CNN classifies based on what the graph looks like in a certain frequency range, but if there is noise that distorts that specific range and some other noise is simply louder (higher dB), the underlying sound can’t be extracted. There is no easy solution to this, as random noise caused by wind doesn’t have a function to model as the input is random. However, I wonder if the randomness of wind sound within a small area might be graphed accurately enough has to bring the accuracy within a reasonable range. After doing some research (and relearning a little calculus!), I’d like to implement some type of stochastic function and use the output of the function to apply a filter to the input sound before being processed by the CNN and see how accurate the model would be when wind is introduced. Such a system would need initial weights, such as the average wind speed of the area for that specific day to increase or decrease the average filter variance. This would mean, for example, if the wind speed in a city was expected to be around 20 mph that day, a weight of 20 would increase the filter noise removal as compared to a calm, sunny day with wind speed at 2 mph on average.
Comparing functions as described in this paper, it seems Brownian motion might not be the most reliable option since the needed wind motion weights would themselves model a semi-random function and not have ‘stationary’ weights as Brownian motion implies. This means in comparing the two functions
$$X(t) = \int\limits_0^t(ε^\frac{1}{2}(u)\partial{B(u)})$$ where B(u) is Brownian motion, and ε is the lognormal statistic defined as:
$$ε(y) = \prod\limits_{i=1}^{n}(W_{i}{y})ε(y)$$ where W is a randomness weight factor corresponding to some position y and the level i in the cascade $$\prod$$
and compared to the function
$$ζ(q) = \frac{q}{3} + \frac{μ}{18}(3q - q^2)$$ where μ would be some weight between 0 and 1, with an optimal level of possibly .25 according to the CALIF analysis of the linked paper. q would be some number depending on circumstance according to the following:
$$0 < q < 3 \Longrightarrow ζ(q) > \frac{q}{3}$$ for expected small fluctuations $$q = 3 \Longrightarrow ζ(q) = 1$$ per Kolmogorv’s 4/5 law $$q > 3 \Longrightarrow ζ(q) < \frac{q}{3}$$ for expected large fluctuations
The second equation, despite being more simple, has actually been found to move accurately model wind speed as a continuous stochastic model without regards to scale dilation, which is exactly what is needed in modeling wind randomness. To implement this in the CNN (or before it), a wind function could be modeled using 2 new methods that I’d like to switch the model to in order to increase maintainability and build upon in the future:
-
Using Uber’s newly released Pyro to model the stochastic function ζ(q)
-
Re-implement the entire model, including the Pyro function, using PyTorch.
These two enhancements should make the code shorter, easier to read and maintain, and allow for easily definable probabilistic stochastic mechanisms to be introduced in the future, perhaps as more refined wind models are created. I also hope to have time to fully read and understand this paper to better understand turbulence generics.
The real issue in implementing a system to filter out the sound from wind (besides actually accurately modeling random wind at a specific point in space) is correlating the equations above to sound on the microphone rather than just wind speed and direction, as the direct correlation isn’t know. This could probably be measured in practice and hopefully a direct correlation would show. This will take some ‘real world’ work and measurements and won’t involve working on the computer, so we’ll see how that goes.
Hopefully this article helped you understand some of the math that goes into more advanced Neural Nets. The white paper isn’t too long, and may be more interesting to people reading casually so please give it a read, a lot of work went into it.
Thanks for reading.